As a visual tool, dis_admin uses icons to let the user trigger actions and to display information by changing the icon shape or color. The icons with all possible states are listed in the tables below.
Table B.1. Node or Adapter State
 | Dolphin Network Manager has a valid connection to Dolphin Node Manager on the Cluster Node. |
 | Dolphin Network Manager cannot reach the Cluster Node using TCP/IP, but the PCI Express network reports no additional problems. |
 | The adapter is wrongly configured, broken or the driver is in an invalid state. |
 | Dolphin Network Manager has detected that the adapter needs firmware update. More information on firmware upgrade can be found in Chapter 9, Firmware upgrade |
 | Adapter has gone into a faulty state where it cannot read system interrupts and has been isolated by the Dolphin IRM driver. |
Table B.2. Link State
 | Green pencil strokes indicates that the links are active. Fat active lines indicates x8 connections. |
 | Red pencil strokes indicate that a link is inactive. Typically, a cable is unplugged, or not seated well. |
 | Gray pencil strokes indicate that links have been disabled. Links are typically disabled when they are not in use. Thin green lines indicate active x4 connections. |
 | A red dot (cranberry) indicates that a problem has occurred since the last check. The red dot will disappear if the problem was transient. You may run dis_diag (dis_diag -V 0, dis_diag -V 1 or dis_diag -V 9 differ in verbosity) from the Node menu to investigate the problem more closely. A red dot is also used to signal if a link has been trained to another PCI Express width than the user configured it to. |
 | Yellow pencil strokes indicate that the link is in protected mode. It is probably in the process of becoming active, or the link training may have failed. |
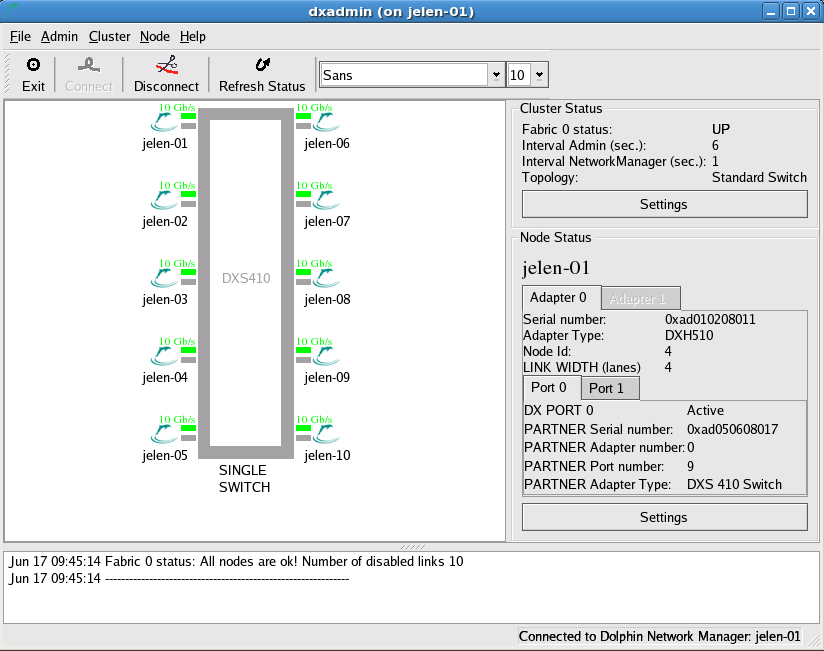
The area at the top right informs about the current cluster status and shows settings of dis_admin and the connected Network Manager. A number of settings can be changed in the Cluster Settings dialog that is shown when pressing the button.
Fabric status shows the current status of the fabric, UP, DEGRADED, FAILED or UNSTABLE (see below).
Check Interval dis_admin shows the number of seconds between each time the Network Manager sends updates to the Dolphin dis_admin GUI.
Check Interval Network Manager shows the number of seconds between each time the Network Manager receives updates from the Node Managers.
Topology shows the current topology of the fabric.
Fabric is UP when all Cluster Nodes are operational and all links OK and therefore plotted in green.
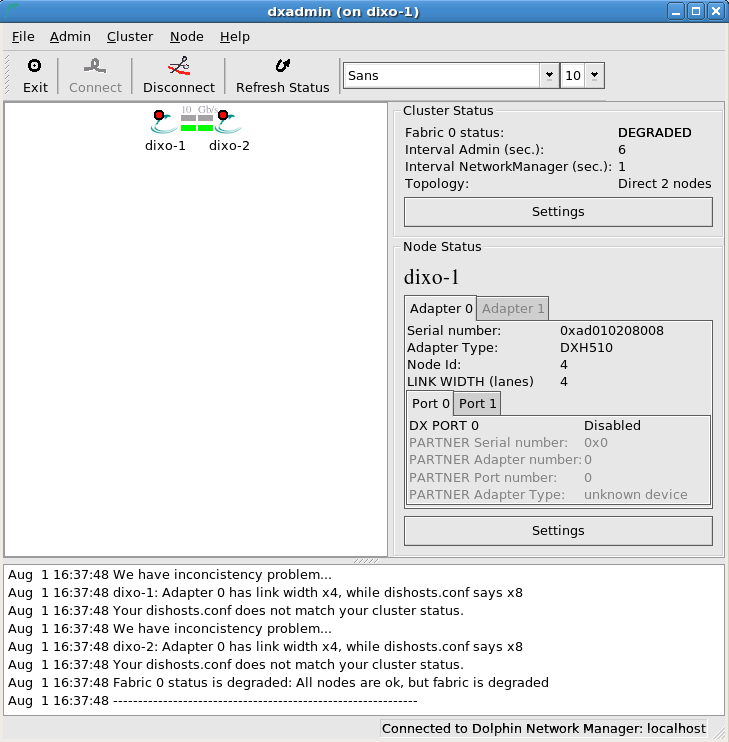
Fabric is DEGRADED when some links operate at x4 in a x8 setup.
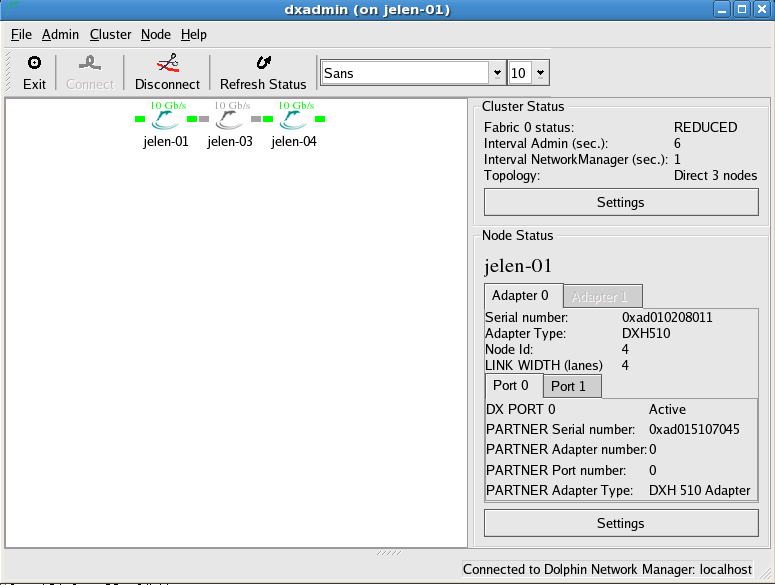
Fabric is REDUCED when all Cluster Nodes are not reachable by Ethernet, but we still have full connectivity for all reachable Cluster Nodes. In the snapshot below jelen-03 is unreachable by Ethernet, but all reachable Cluster Nodes operate fully.
Fabric is in status FAILED if several links are broken in a way that breaks the full connectivity. In the snapshot below the PCIe link connecting port 1 of Jelen-03 to port 0 of Jelen-04 is unplugged. Node jelen-03 and jelen-04 can not communicate via PCIe in this situation, and SuperSockets-driven sockets will have fallen back to Ethernet.
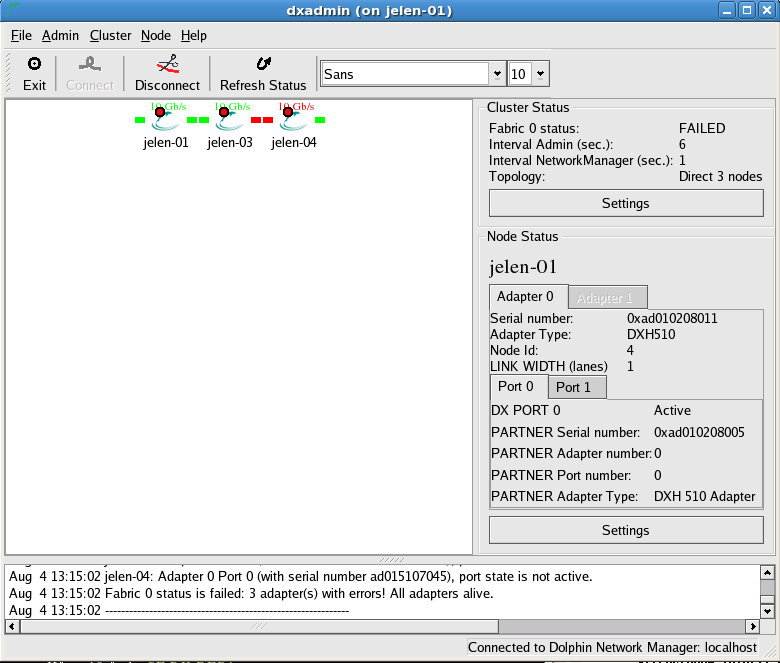
The fabric status is also set to FAILED if one or more Cluster Nodes are dead as this Cluster Node can not be reached via PCI Express in a 2 Cluster Node direct topology. The reason for a Cluster Node being dead can be
Node is not powered up. Solution: power up the Cluster Node.
Node has crashed. Solution: reboot the Cluster Node.
The IRM low-level driver is not running. Solution: start the IRM driver like
# service dis_irm start
The node manager is not running. Solution: start the node manager like
# service dis_nodemgr start
The adapter is in an invalid state or is missing. Please check the Cluster Node, and also consider the related topic in the Chapter 16, FAQ, .
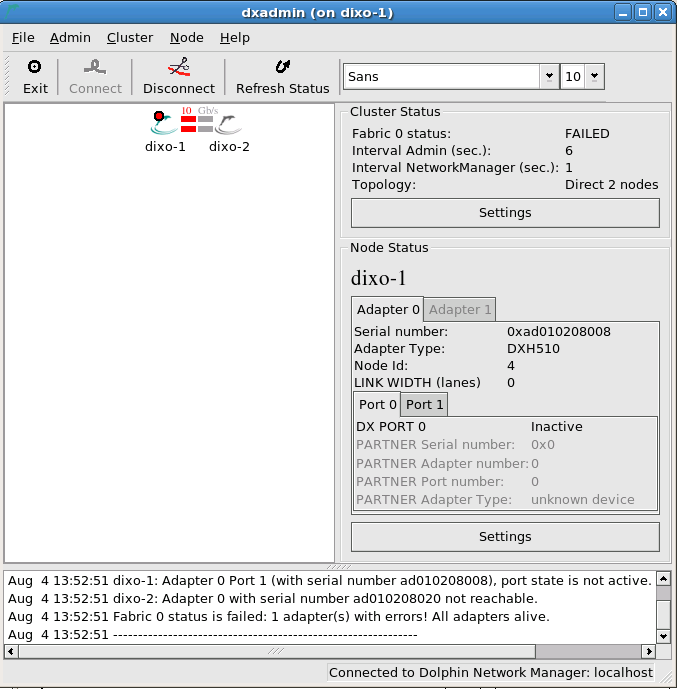
The status of a Cluster Node icon tells if a Cluster Node is up, Ethernet is out, or faulty, and a link is broken (red), disabled (grey) or up (green). When selecting a Cluster Node you will see details in the Node Status area:
To get more information on the interconnect status for a Cluster Node, get its diagnostics via
Serial number. A unique serial number given in production.
Adapter Type: The Dolphin part number of the adapter
Adapter number: The number of the adapter selected